

News
Dec 10
Amber Roepe selected for APS Division of Particles and Fields Ethics Advisory Committee
This past summer, the American Physical Society’s (APS) Division of Particles and Fields (DPF) formed the Ethics Advisory Committee (EAC). The...
Mar 25
Physics & Astronomy Offices are Closed
In order to comply with recent public health statements from our Provost, in consultation with OUHSC and the Centers for Disease Control, our departmental offices...
Aug 26
CQRT hiring multiple faculty: applications due by October 20
The Homer L. Dodge Department of Physics and Astronomy at the University of Oklahoma (OU) invites applications for five faculty appointments in the areas of...
Jul 29
Conference for Undergraduate Women in Physics
CUWiP, also known as Conference for Undergraduate Women in Physics, is an annual conference series that has been running since 2006. Since its start, conference participation...

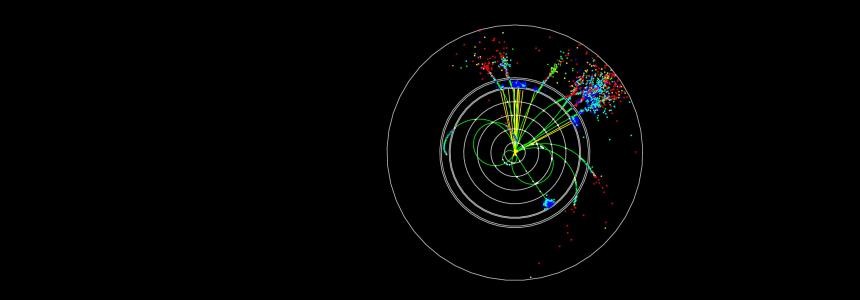
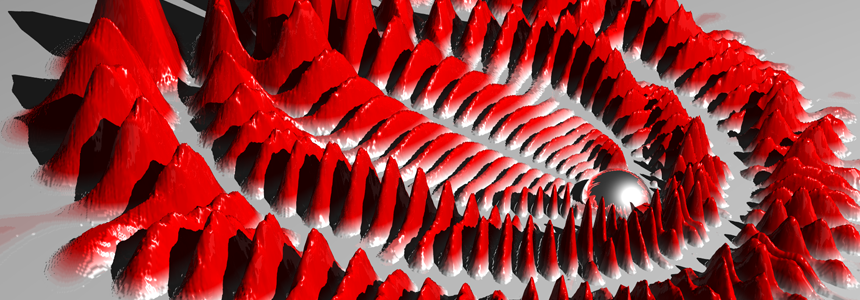
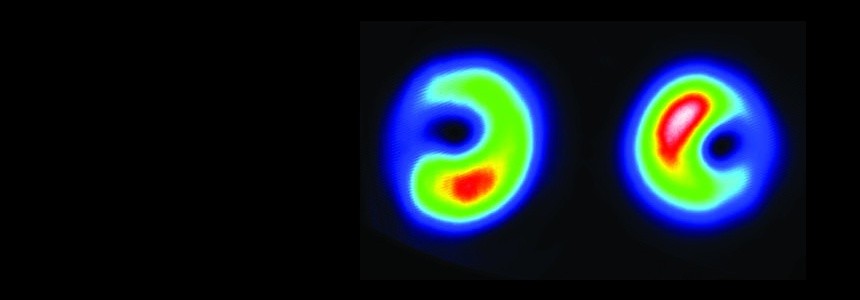
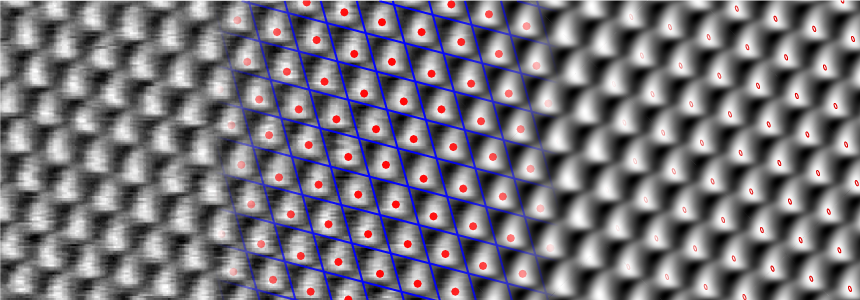
Featured Research: Watching Atoms Bang Together
Collisions between atoms are more complex than those between everyday objects, which typically just ricochet off one another. Thanks to the quirks of quantum mechanics, atoms can intertwine and pass through one another, leading to nonintuitive impact outcomes. To better understand atomic collisions, Qingze Guan of the University of Oklahoma in Norman and colleagues developed a way to watch two atoms crash together in 3D. Their initial experiments reveal the unmistakable hallmarks of quantum collisions. The team says that the setup could be used to monitor run-ins between several particles at…
