Lab 7: RLC Resonant Circuits
In this lab you will use the function generator and the oscilloscope to measure the voltage and phase in a resonant parallel and series RLC network. The measurements you will perform are very similar to those you did for the steady-state RC network lab. However unlike RC networks, RLC networks can be resonant. Unlike the RC Networks lab, the focus is to measure the center frequency and Q of the circuits rather than to take data over the entire frequency range.
In order to do this lab you need to understand:
1) the characteristics of
band-pass and notch filters,
2) how to find the 3 dB points, and
3) how to measure frequency and phase.
Reading Ch 2. 30 + lecture notes.
The RLC network. For
these measurements we will construct series and parallel RLC networks on your
breadboard. Your will apply a sine wave using your function generator
and make the measurements using your oscilloscope.
Use the following values: R = 100 W & 1 K, L = 10 mH, and C
= 1 μF.
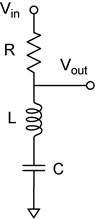
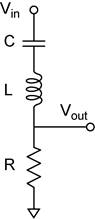
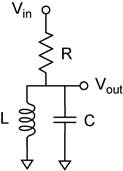
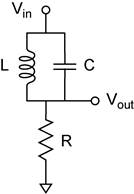
The four networks you will construct are shown below. Two of them should be band-pass filters and the other two should be notch filters.
Calculate the resonant
frequency you expect based on the labeled component values (![]() ). Now
measure the resistance of your L (RL) using
your DMM and record it in your notebook. Measure the capacitance of your
capacitor with the capacitance meter and record that in your notebook. Later
you will model the circuit using these values (maybe).
). Now
measure the resistance of your L (RL) using
your DMM and record it in your notebook. Measure the capacitance of your
capacitor with the capacitance meter and record that in your notebook. Later
you will model the circuit using these values (maybe).
Function generator set up. Connect the function generator to your circuit. Use a BNC Tee to also connect the function generator to channel 2 of your scope. Set the function generator to output a 1 kHz sine wave with a 5 Vp-p amplitude and zero DC offset. Trigger of the scope from channel 2 as you have done before.
Oscilloscope probes. Obtain a scope probe and connect it to channel 1.
Scope set up. Set up the scope so you can see the traces of both channels. Connect the probe to Vin. Verify that this voltage is and should be the same as observed in channel 2. You will use a combination of automatic and cursor measurements.
Automatic measurement set up.
· Clear any existing measurements.
· 1st measurement: source = CH1; Voltage = Vp-p
· 2nd measurement: source = CH2; Time = Period
· 3rd measurement: source = CH2; Voltage = Vp-p
Cursor set up.
· Mode = Track
· Cursor A = CH2
· Cursor B = CH1
The time delay of channel 1 with respect to channel 2 is now Δx.
Set up and plan your measurements. We want to measure the magnitude and the phase of the voltage Vout at 3 frequency points for each filter. The point at the center frequency (resonance frequency) and a data point at each of the 3dB points (Vout/Vmax = 1/√2).
3dB points. Be careful! The 3 dB points are defined with respect to the maximum of the Vout/Vin. For the band-pass filter 3 dB is measured from maximum of Vout/Vin at the center frequency. For the notch filter 3 dB is measured from maximum of Vout/Vin far away from the notch. The 3dB point is measured with respect Vmax, not Vin. You will adjust the frequency of your function generator so that Vout/Vmax = 1/√2. You will need to measure all three frequencies.
Make the measurements of Vout. Set up the trace Vout and Vin on the scope so that you can observe one complete cycle. For each frequency your will need three measurements: The period, the magnitude of the voltage Vout, and the time delay of Vout with respect to Vin. Prepare a table in your notebook to record these values. You will have one table for each of the four circuits.
You
will perform a set of measurements with R = 100 W and with R = 1 K.
Reference (you do not need to answer questions in this section).
All measurements will be made using the scope. You have seen in previous labs that the numbers on the function generator and on the scope do not agree. So we will make all the measurements using one device, your scope.
Measuring frequency. We will measure the period, because the period is used for calculating the phase. Frequency will be calculated form the period.
Measuring phase. Phase is always a relative measurement. That is, it is measured with respect to some reference point. In this measurement we are comparing the phase shift of the sine wave Vout with respect to V0. Thus V0 is the phase reference. Measuring the time difference between a reference point on the V0 sine wave and the same point on the Vout sine waves best does this.
The phase shift in degrees is then obtained knowing the period of the wave and that a single period is 360 degrees.
|
FILTER |
|
Vin |
Vout |
||
|
|
measurement |
|
amplitude |
time delay |
amplitude |
|
|
center freq |
|
|
|
|
|
|
upper 3 dB |
|
|
|
|
|
|
lower 3 dB |
|
|
|
|
The Quality Factor. The quality factor of the resonance is Q = f0/Δf, where Δf is the width at the 3 dB point and f0 is the resonant frequency. This width is often referred to as the full width at half power maximum (FWHM). Calculate Q for your network (see the lecture notes and the text).
RLC Resonant Circuits Lab (50pts) NAME ________________________________
section ______ Lab Partner ________________________________
Data work up: Fill in the tables (after completing the calculations in your notebook)
- Note the type of filter: band-pass or notch.
- Show the schematic in your table so we can tell that you know which circuit you measured.
|
filter type: |
measurement |
freq |
Vout/Vin |
phase |
|
|
schematic |
|||||
|
center freq |
|
|
|
||
|
upper 3 dB |
|
|
|
|
|
|
lower 3 dB |
|
|
|
|
|
|
Q = |
|
||||
|
filter type: |
measurement |
freq |
Vout/Vin |
phase |
|
|
schematic |
|||||
|
center freq |
|
|
|
||
|
upper 3 dB |
|
|
|
|
|
|
lower 3 dB |
|
|
|
|
|
|
Q = |
|
||||
|
filter type: |
measurement |
freq |
Vout/Vin |
phase |
|
|
schematic |
|||||
|
center freq |
|
|
|
||
|
upper 3 dB |
|
|
|
|
|
|
lower 3 dB |
|
|
|
|
|
|
Q = |
|
||||
|
filter type: |
measurement |
freq |
Vout/Vin |
phase |
|
|
schematic |
|||||
|
center freq |
|
|
|
||
|
upper 3 dB |
|
|
|
|
|
|
lower 3 dB |
|
|
|
|
|
|
Q = |
|
||||
Summary
|
filter type: |
band pass |
notch |
||||||
|
parallel |
series |
parallel |
series |
|||||
|
100 W |
1 K |
100 W |
1 K |
100 W |
1 K |
100 W |
1 K |
|
|
Q measured |
|
|
|
|
|
|
|
|
|
Q calculated |
|
|
|
|
|
|
|
|
|
fcenter (measured) |
|
|
|
|
|
|
|
|
|
fcenter (calculated) |
|
|
|
|
|
|
|
|
