Lab 4: AC Test Instruments: Oscilloscope and Function Generator
In this lab you will learn basic operation of the digital oscilloscope and function generator.
The user guides and manuals for the oscilloscope, function generator, and DMM are posted on the course web site. Follow the link on the home page Link to Test Equipment Documentation.
Reading Ch 2.20.5-8, 2.21, 7.4+ lecture notes.
Components:
· Rigol digital oscilloscope (DS1102E)
· Rigol function generator (DG1022A)
· EXTEC DMM (EX330)
· bread board
· 3× BNC cables
· BNC TEE
· 2× BNC to minigrabber adapters
· BNC to dual-bananna adapter.
· 100 W resistor
· 1 M resistor
· 3× 10K resistors

PART 1) Setting up a basic measurement. Connect the channel 1 output of the function generator (FG) to the channel 1 input of the oscilloscope (scope). Turn on the FG and the scope.
Basic FG set up.
· Adjust the output of the FG so that channel 1 is a sine wave with an amplitude of 5 Vp-p with zero DC offset and a frequency of 1 kHz.
· Adjust the oscilloscope to display only channel 1.
Basic scope set up. The DS1102E scope can display a wide range of voltage signals, from DC to 100 MHz. (The upper frequency limit is determined by how much you are willing to pay.) The scale is the 12×8 grid. The length of one grid block is called on division. Typically voltage is displayed on the vertical axis and time on the horizontal axis. The volts per division and time per division is adjustable and is displayed in the text at the bottom of the scope display. The position of zero can be adjusted for convenience—try the vertical and horizontal position knobs. The marker on the left edge shows the position of the voltage zero for each channel. The marker on the top edge shows the position of the time zero.
· Set the vertical scale to 1 V/div and the horizontal to 200 μs/div.
· Position the zero volts level and the zero time to coincide with the center lines.
Triggering. The scope repetitively records “snapshots” of the input waveform and displays it on the screen. If the waves in successive snapshots do not overlap with the previous wave, the displayed wave may perceived by us as a blur. If successive waves are only slightly offset, we will perceive the displayed wave as moving across the display. Triggering is a way to synchronize the “snapshots” of successive waves so that they overlap exactly. The scope does this by monitoring the voltage of the input signal, then triggering the snapshot when the voltage crosses a selected value. This can be further refined to trigger only when the input signal crosses that voltage with a rising slope (or falling slope). Explore the triggering options on the menu. The trigger level (voltage) is visible on the display while it is being adjusted.
· Select triggering from channel 1 with a rising slope.
· Adjust the triggering level so that it is within the displayed channel 1 waveform.
Measurements. We will explore both manual and automatic measurements. Here we will set up the basic automatic measurements. Explore the measurement menu. Note that a maximum of three measurements can be selected. If more are selected, the first rolls off the list.
Basic automatic measurement set up.
· Clear any existing measurements.
· Under source, select channel 1
· 1st measurement: Under voltage, select Vp-p
· 2nd measurement: Under voltage, select Vrms
· 3rd measurement: Under time, select frequency
Manual measurements are simple to perform. It is essential to understand how to perform manual measurements. Automatic measurements are not always appropriate and can sometimes give erroneous results. You must be able to check the automatic measurement against the manual measurement. The scope is an excellent tool, but it is a machine with a very specific program. Only you, the operator, can determine if the automatic measurements are appropriate. Be skeptical. Test the automatic against the manual. Your instructor will demonstrate how manual measurements are made.
Construct the table below in your laboratory notebook. Compare the frequency and amplitude measurements for three different waveforms. Record all digits given in the displays. Manual measurements should be read to the nearest 0.1 div.
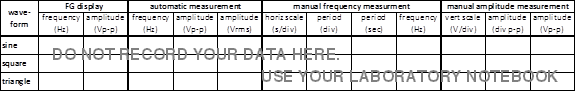
WARNING ABOUT AUTOMATIC MEASURMENTS. The automatic measurements are derived from the digitized waveforms displayed. If the waveform is clipped the measurement will fail (*****). If the wave form is significantly smaller than a division, the measurement can be wildly inaccurate. This issue is true for both amplitude and time measurements. The rule of thumb: set the horizontal and vertical scales so you can see the waveform clearly defined over many divisions. You have a 12×8 division area—use it!
Table 1) 6 pts. For each waveform, calculate the percent error for both the automatic and manual amplitude (Vp-p) and frequency measurements. Use the numbers from the FG as correct (reference). Record these results in a table.
![]()
Q 1) 2 pts. What is the average percent measurement error for the automatic measurements? And for the manual measurements?
Q 2) 3 pts. What is the exact mathematical factor relating the Vp-p to Vrms for each of the three waveforms?
part 2) Measuring the source resistance of the FG (Rs) and the input resistance of the scope (Rm). In these measurements we will assume that RS << RM. After we perform the measurements, we will re-examine the validity of this assumption. Set the FG to output a 5 Vp-p, 1 kHz sine wave. Use 2 BNC cables. Connect the one BNC cable to FG and the other to the scope. Put a BNC to minigrabber on the free ends of the two BNC cables.
Measuring the source resistance of the FG (RS). Connect the red minigrabbers together and the black minigrabbers together. Using the automated measurement, record the peak-to-peak amplitude. Because RS << RM this approximates the open circuit amplitude of the FG.
Add a 100 W load resistor, RL, to the FG by adding to the circuit above in parallel to the FG. The result is shown in the schematic on the right. The amplitude should be reduced. Measure the new peak-to-peak amplitude.
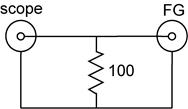
Q 3) 6pts total. 2pts) Draw the schematic showing the scope, the FG, RS, and RL (the 100 W resistor), (Hint: ignore RM.). 2 pts.) Solve for RS in terms of the amplitudes you measured with and without RL. Show your algebra. 1pt.) Give the result for RS. 1pt.) What does the manufacturer specify for RS?
Measuring the input resistance of the scope (RM). Connect the red minigrabbers together and the black minigrabbers together. Using the automated measurement, record the peak-to-peak amplitude. Because RS << RM this approximates the open circuit amplitude of the FG.
Add a 1 M series resistor, RA, in series with the red minigrabbers. The result is shown in the schematic on the right. The amplitude should be reduced. Measure the new peak-to-peak amplitude.
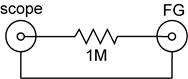
Q 4) 6pts total. 2pts) Draw the schematic showing the scope, the FG, RM, and RA (the 1 M resistor), (Hint: ignore RS.). 2 pts.) Solve for RM in terms of the amplitudes you measured with and without RA. Show your algebra. 1pt.) Give the result for RM. 1pt.) What does the manufacturer specify for RM?
Q 5)
2pts. Consider now the FG connected directly to the scope as you did
initially in part 2. The FG outputs voltage V and the scope measures
voltage Vm. What is the percent error in the voltage
measurement caused by RM and RS?
Hint: Use circuit analysis to calculate Vm and thereby the
percent error.
part 3) Grounding. Begin with the setup from part 2. Connect the red minigrabbers together and the black minigrabbers together.
· Using the automated measurement, record the peak-to-peak amplitude.
· Disconnect and then reconnect the red minigrabbers and observe what happens.
· Disconnect and then reconnect the black minigrabbers and observe what happens.
· Attempt to invert the polarity of the signal by crossing the connection red-black and black to red, respectively and observe what happens.
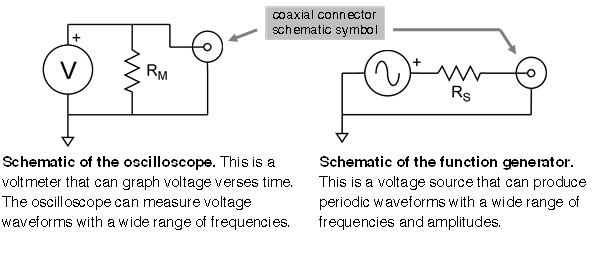
Q 6) 4pts. Explain the behavior. (Hint look at the schematics for the scope and the FG on the first page.)
Using the scope to probe a circuit. Construct the voltage divider from three 10 K resistors in series. Drive the circuit with the FG set to output a 5 Vp-p, 1 kHz sine wave. Connecting directly using the minigrabbers is an expedient plan. See the schematic on the right.
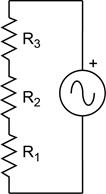
Q 7) 3pts. Based what you know about voltage dividers, what peak-to-peak voltage should be present across R1, R2, and R3?
Use the scope to measure the peak-to-peak amplitude across each resistor with the minigrabbers.
Q 8) 3pts. List the peak-to-peak voltages you measured in this manner across R1, R2, and R3.
Q 9) 5pts total. 2pts) Why is this not what you predicted in Q7? 3pts) How can the voltage across each resistor be measured using the scope?
part 4) Triggering fun. Set up the FG. Configure channel 1 to output a 5 Vp-p, 1.0000 kHz sine wave AND channel 2 to output a 5 Vp-p 1.0001 kHz triangle wave. Connect the FG channel 1 to the scope channel 1 and FG channel 2 to scope channel 2.
Set up the scope. Enable the display of both channels. set both channels to a vertical scale of 1 V/div and a horizontal scale of 200 μs/div. Center the vertical and horizontal zeros.
· Explore the effect of the trigger level.
· Explore the trigger menu. Set source = “CH1” and mode = “edge”. Observe the effect of the slope.
· Set source = “CH2”. Observe.
· Adjust the frequency of the FG channel 2 waveform. Set the cursor on the 0.1 Hz place (f2 = 1.000,100,0 kHz) turn the knob to fine tune the frequency in increments of 0.1 Hz. Note the behavior of the displayed waveforms when f1 < f2, f1 = f2, f1 > f2 and when the frequencies are very different.
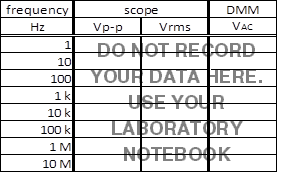
part 5) Compare the Scope to the DMM. Set up the FG. Configure channel 1 to output a 5 Vp-p, 1 kHz sine wave. Use a BNC Tee to connect the FG channel 1 to the scope channel 1 and to the DMM using a BNC to dual banana adapter. Configure the automatic measurements of the scope for Vp-p and Vrms on channel 1. Set the DMM to read Vac.
Construct the table shown below. Adjust the frequency of the sine wave to complete the table. Begin at 1 Hz and take measurements every decade up to 10 MHz.
Q 10) 6pts total. 2pts) Within what approximate frequency range is the DMM useful for voltage measurements? 2pts) Speculate why the DMM Vac mode in not useful at low frequencies? 2 pts) Speculate why the DMM Vac mode in not useful at high frequencies?
Q 11) 4pts.
What voltage measurement does the DMM provide? Why is that measurement
preferred for a DMM?
